

White paper 1 of 5
Weather and Engine Power in Motorsport: Air Density, Humidity and Density Altitude
Download PDF 30 pages, US Letter
Contents
Executive Summary
An engine makes power from the oxygen it traps. The oxygen in each liter of air is set by the dry air in it, not by Air Density alone. Between a cool, dry morning and a hot, humid afternoon at the same track, Air Density can fall 11.1 % while the oxygen per liter falls 12.4 %. The gap is water vapor, which takes up room but adds no oxygen the engine can burn.
Each power adder handles the air differently. A turbocharger or supercharger moves the problem rather than removing it: holding boost in thinner air makes the compressor work harder and run hotter, and the air's water rides through to the charge. Nitrous oxide adds a fixed oxygen supply beside the changing one, so its share of the total shifts with the weather. Compressed air from tanks replaces the day's air for the run altogether.
Fuel choice does not lift the oxygen limit. Gasoline, E85, ethanol and methanol release nearly the same energy per kilogram of air. They differ in charge cooling, knock margin and, for E85, in what is actually in the tank.
Dyno correction standards each treat the air differently, so the most durable record is the air itself: Ambient Air Temperature, Absolute Pressure, and Mixing Ratio or Relative Humidity, logged with the run. Section 10 lists which channels to log for each engine type and fuel, and why.
Units and Conventions
SI units come first, with US customary units in parentheses. Temperatures are in °C (°F); equations that need absolute temperature use kelvin (K), and temperature differences are in K (°F). Atmospheric pressure is in kPa (inHg). Other pressures are in kPa or MPa (psi), marked gauge (psig) or absolute (psia). Mass flow is in kg/s (lb/h, the unit racers use for injector flow), displacement in L (cu in) and density in kg/m³ (lb/ft³).
Every equation is written in SI units and must be evaluated in them; convert the results afterwards. Each equation is followed by a smaller paragraph that defines its symbols, and constants are collected in tables. Readers who want only the practical points can skip those parts.
1.0 Fundamentals: What an Engine Takes From the Air
An engine's power is set by the mass of oxygen it traps each cycle, because fuel can only release its energy with the oxygen available. The air supplies that oxygen, and the amount in each liter changes with temperature, pressure and humidity. This section shows why, and why Air Density alone does not tell the whole story.
1.1 Partial Pressures
Air at the track is a mixture of dry air and water vapor. Each part carries its own share of the total pressure, called its partial pressure. At ground-level conditions each part behaves very nearly as an ideal gas, so its density follows from its own pressure and the temperature:
Here is the total (station) pressure, the dry-air partial pressure and the water-vapor partial pressure. and are the partial densities of dry air and vapor, is absolute temperature, is the molar gas constant, and and are the molar masses of dry air and water [1]. Table 1 gives the constants.
| Quantity | Symbol | Value | Source |
|---|---|---|---|
| Molar gas constant | 8.314 472 J/(mol·K) | [1] | |
| Molar mass of dry air | 28.965 46 g/mol | [1] | |
| Molar mass of water | 18.015 28 g/mol | [1] | |
| Ratio of molar masses | 0.622 | Computed from [1] | |
| Oxygen in dry air, by amount of substance | — | 20.939 % | [1] |
| Oxygen in dry air, by mass | — | 23.13 % (0.2313) | Computed from [1] |
| Compressibility factor, 0–35 °C (32–95 °F), sea-level pressure | 0.9994 to 0.9998 | Computed from [1] | |
| Stated range of the CIPM-2007 equation | — | 15–27 °C (59–81 °F); 60–110 kPa (17.7–32.5 inHg) | [1] |
1.2 The Oxygen-Bearing Part Is the Dry Air
Oxygen is a fixed share of dry air, and none of it comes with the water vapor. So the oxygen in each cubic meter of air is the dry-air partial density times a constant:
The constant 0.2313 is oxygen's share of dry air by mass, from the composition used by the international air-density standard [1] (Table 1). is the compressibility factor of Eq. 1.3, and includes the small enhancement factor of [1]; both are used in every computed value in this paper.
In plain terms, the oxygen per liter rises with pressure, falls with temperature, and falls as water vapor takes up part of the pressure.
1.3 Air Density Is a Different Number
Air Density adds the water vapor back in. Water vapor is lighter than the dry air it displaces, so humid air is less dense than dry air at the same temperature and pressure. But humid air loses oxygen about 2.7 times faster than it loses mass (Section 9, Example 2). That is why two experienced people can quote different numbers for "how much humidity matters" and both be right.
The reference formulation for moist-air density is the CIPM-2007 equation, used in mass metrology [1]:
Here is the mole fraction of water vapor (about , with a small enhancement factor) and is the compressibility factor (Table 1). This paper applies the equation a little outside its stated range, to 0–35 °C (32–95 °F), where its terms vary smoothly and the effect on the results is small.
1.4 Mass Flow and Power
An engine is an air pump. The air mass it moves each second, and the power that air can support, are:
Here is volumetric efficiency, the inlet air density, the displaced volume, the crankshaft speed (rev/s) and crank revolutions per intake stroke for a four-stroke engine. is the fuel conversion efficiency, the fuel's heating value and the fuel–air ratio.
At a fixed mixture strength, the fuel that can be burned, and so the power, follows the dry air delivered, not the total. The engine-test standards reflect this. The UN regulation for engine power measurement corrects to a reference dry-air pressure of 99 kPa (29.23 inHg): total barometric pressure minus water-vapor pressure (Section 11).
Two cautions apply. First, is not a constant. It changes with engine speed, intake and exhaust tuning, and charge temperature, so Eq. 1.4 describes the trend at one operating point, not a forecast of power. Second, the density that matters is the density at the inlet, after any heat soak, compressor or intercooler. That is why the ambient air and the engine's own intake channels are logged together.
1.5 Oxygen Paths by Power Adder
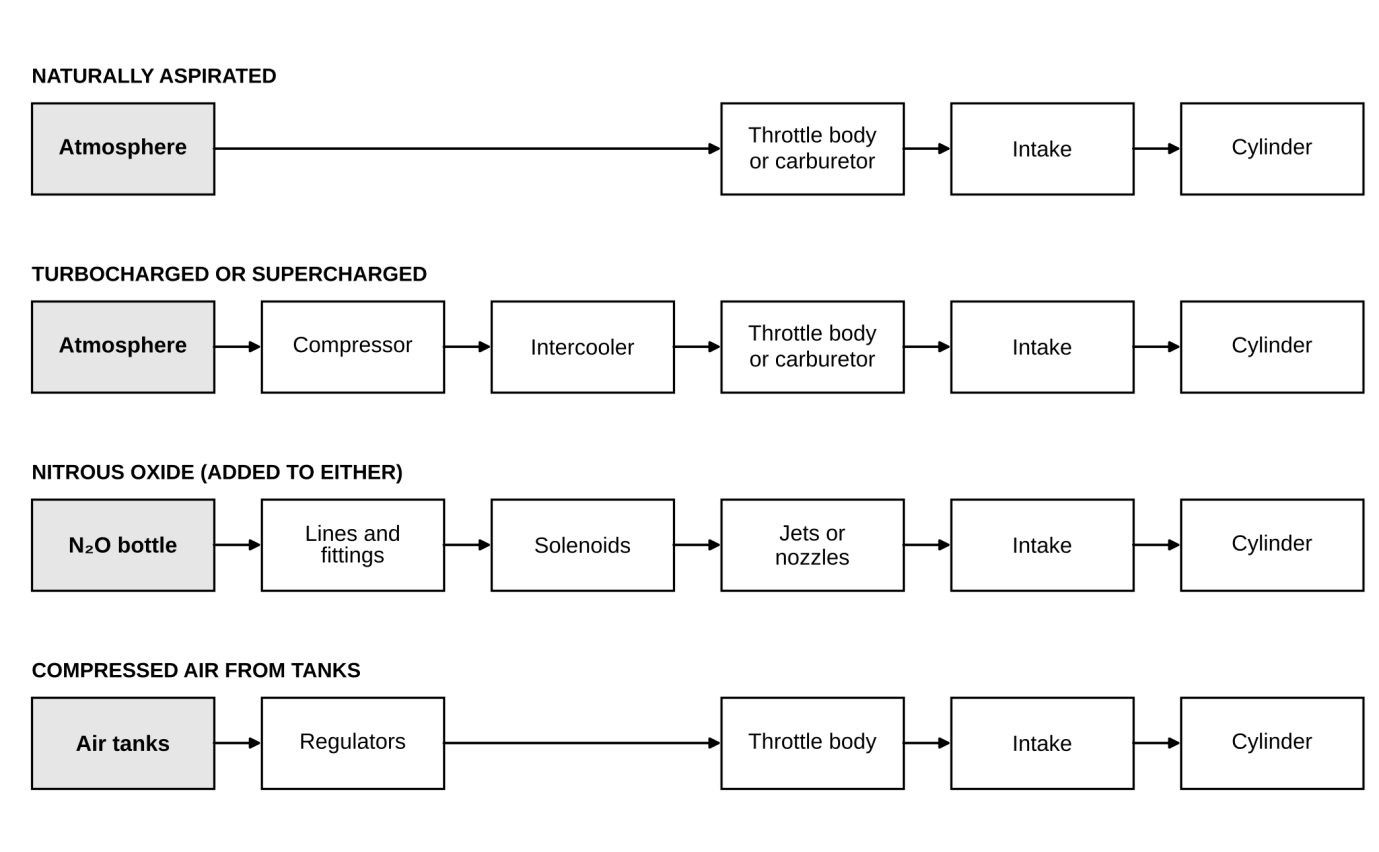
Figure 1 shows where each engine type gets its oxygen. A naturally aspirated engine draws it from the atmosphere through the throttle body or carburetor. A boosted engine compresses and cools the same air first. Nitrous adds a second supply, set by the bottle and its plumbing rather than by the weather. Compressed air from tanks replaces the day's air for the boosted part of the run. Sections 3 through 6 take each path in turn.
2.0 The Variables and the Derived Channels
Three quantities are measured: temperature, pressure and humidity. Everything a tuner or engineer watches is derived from them. The channel names below are used throughout this series.
2.1 Saturation Vapor Pressure,
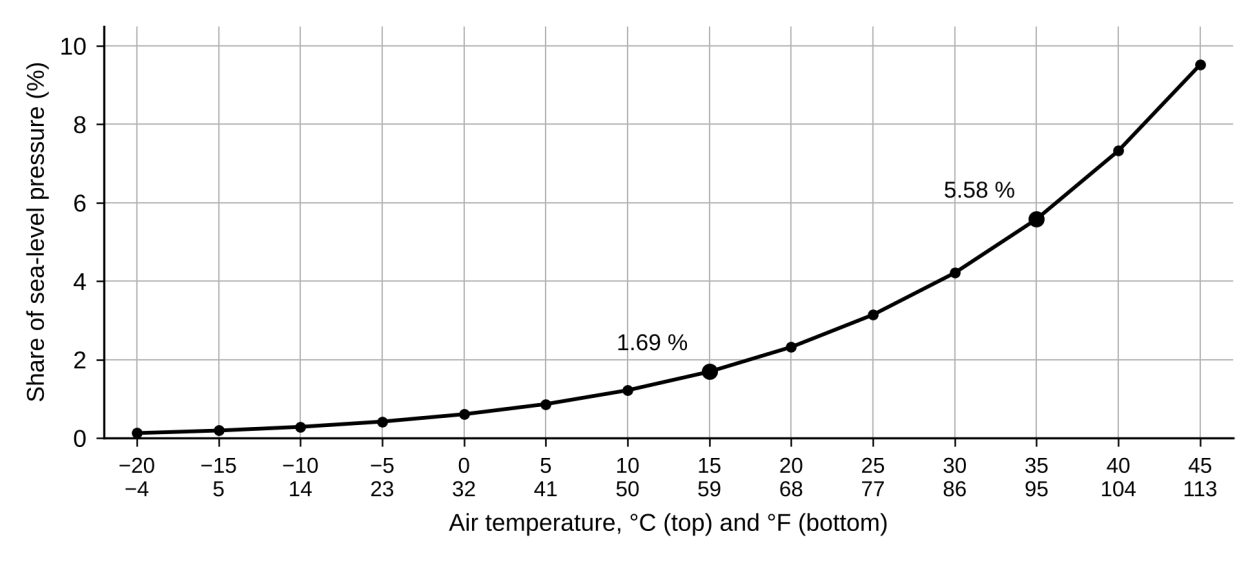
Saturation vapor pressure is the most water vapor the air can hold at a given temperature, expressed as a pressure. It rises steeply with temperature (Figure 2). That is why humidity matters little on a cold day and a great deal on a hot one. For liquid water, the reference equation is that of Wagner and Pruss [2]:
Here and are the critical temperature and pressure of water (Table 2) and are the published coefficients [2]. The CIPM-2007 density equation uses a simpler fit of its own [1]; the two agree within 0.004 % between 0 and 35 °C (computed).
2.2 Relative Humidity
Relative humidity says how close the air is to saturation: , with taken over liquid water at the air temperature, as in CIPM-2007 [1]. It does not say how much water the air carries. Air at 60 % RH holds very different amounts of water at 10 °C (50 °F) and at 35 °C (95 °F).
2.3 Dew Point
Dew Point is the temperature at which the water already in the air would saturate it: . In plain terms, it is the amount of water expressed as a temperature. It does not change when the air warms or cools without gaining or losing water. It does change when the air is compressed, because rises in proportion to pressure (Eq. 1.1; Section 4).
2.4 Mixing Ratio (Water Grains)
Mixing Ratio, also called the humidity ratio and the racer's water grains, is the mass of water per mass of dry air. It is the ratio of the two partial densities in Eq. 1.1:
Here is the ratio of the molar masses of water and dry air (Table 1). Mixing Ratio is reported in g/kg or grains per pound (1 g/kg = 7.000 gr/lb).
Mixing Ratio is the humidity channel that speaks to an engine. It says how much of every kilogram of dry air arrives with water instead of more oxygen-bearing air.
2.5 Absolute Humidity
Absolute Humidity is the mass of water per volume of air, in Eq. 1.1. It is useful for comparing climates, but it changes with temperature and pressure even when no water is added.
2.6 Air Density and Relative Air Density
Air Density is the moist-air density of Eq. 1.3. Relative Air Density expresses it as a percentage of the sea-level density of the standard atmosphere [3]: , with in Table 2.
2.7 Pressure Altitude
Pressure Altitude is the height in the standard atmosphere where the standard pressure equals the measured station pressure [3]:
Here , , , , and are the standard-atmosphere constants in Table 2 [3]. The US National Weather Service's operational form [4], also in Table 2, agrees with Eq. 2.3 within about 0.6 m (2 ft) between 84 and 110 kPa (computed).
| Quantity | Symbol | Value | Source |
|---|---|---|---|
| Critical temperature of water | 647.096 K | [2] | |
| Critical pressure of water | 22.064 MPa (3,200 psia) | [2] | |
| Sea-level temperature | 288.15 K (15 °C, 59 °F) | [3] | |
| Sea-level pressure | 101.325 kPa (29.92 inHg) | [3] | |
| Sea-level density | 1.2250 kg/m³ (0.07647 lb/ft³) | [3] | |
| Temperature lapse rate | 0.0065 K/m (3.57 °F per 1,000 ft) | [3] | |
| Standard gravity | 9.80665 m/s² (32.174 ft/s²) | [3] | |
| Gas constant of the standard atmosphere | 8.314 32 J/(mol·K) | [3] | |
| Molar mass of air in the standard atmosphere | 28.9644 g/mol | [3] | |
| Exponent in Eq. 2.3 | 0.190 263 | Computed from [3] | |
| Exponent in Eq. 2.4 | 0.234 969 | Computed from [3] | |
| National Weather Service form of Eq. 2.3 | — | [4] |
2.8 Density Altitude
Density Altitude is the height in the standard atmosphere where the standard density equals the measured Air Density. It follows from the same relations [3]:
The constants are those of Eq. 2.3 (Table 2).
Because Air Density includes water vapor, so does Density Altitude computed this way. The National Weather Service form reaches a closely similar result through the virtual temperature [4]. Formulas that use the dry-bulb temperature ignore humidity, and on a hot, humid day they read about 100 m (320 ft) low (Section 8).
2.9 Specific Enthalpy
Specific Enthalpy is the heat content of moist air per kilogram of dry air [5]. In SI practice, kJ/kg with in °C, which is zero for dry air at 0 °C. The inch-pound form, BTU/lb with in °F, is zero for dry air at 0 °F [5]. Because the zero points differ, a kJ/kg value converted to BTU/lb is not the number an inch-pound psychrometric chart shows (Section 8).
3.0 Naturally Aspirated Engines
A naturally aspirated engine fills its cylinders from the air around it, so its oxygen supply follows the dry-air density of that air almost one for one (Eq. 1.2 and 1.4). Figure 3 shows its oxygen path. In Example 1, the dry-air density falls 12.4 % from a cool, dry morning to a hot, humid afternoon at the same track, while Air Density falls 11.1 %. At a track with 84 kPa (24.81 inHg) station pressure, about 1,550 m (5,100 ft) of Pressure Altitude, it is about 20 % lower than on that cool morning (Section 9).

3.1 Why Humidity Matters More on Hot Days
Water vapor displaces dry air in proportion to its partial pressure, and the most the air can hold grows steeply with temperature (Figure 2). At 15 °C (59 °F), going from bone-dry to saturated air removes 1.7 % of the oxygen per liter. At 35 °C (95 °F) it removes 5.6 % (Example 2, Figure 8). Humidity is a small term in cold weather and one of the largest in a summer heat wave.
3.2 What the Engine Actually Breathes
The density in Eq. 1.4 is the density at the intake, not at the weather station. Under-hood heat, a hot intake tract and slow-moving air in the pits all raise the intake temperature above ambient, and the gap changes through a session. So the ambient Air Density channel and the engine's own intake air temperature are worth logging side by side. The first describes the day, the second describes the charge, and the difference between them belongs to the installation.
3.3 Volumetric Efficiency Is Not Fixed
depends on engine speed, intake and exhaust tuning, valve events and charge temperature. A percentage change in density is therefore a guide to the direction and rough size of a power change at one operating point, not a prediction of the dyno sheet. The standard power-correction methods (Section 11) exist to give a repeatable, agreed approximation.
3.4 How the Fuel System Responds Is a Property of That System
Some fuel systems meter fuel from measured air flow, manifold pressure or air temperature. Others, including some mechanical systems, do not compensate for air density. Which applies is set by the system and its calibration. Nothing in this paper describes what a particular fuel system or ECU does; that belongs to its own documentation. What the air does is the same for all of them, and logging it separates a change in the result from a change in the system.
4.0 Forced Induction: Boost Reference, Compressor and Charge Temperature
A turbocharger or supercharger raises the inlet density by compressing the air, so the engine depends less on the atmosphere's pressure. But the compressor still starts from that atmosphere, and the air's pressure, temperature and water all pass through to the charge. Figure 4 shows the path.

4.1 Gauge or Absolute: Which Pressure Is Held
Boost is usually quoted as gauge pressure, above the local atmosphere. The compressor's pressure ratio, though, is always absolute outlet pressure over absolute inlet pressure:
Here and are the absolute inlet and outlet pressures, is the station pressure, and the second term on top is the gauge boost. Inlet losses are ignored.
Two cases follow. If the boost controller holds a fixed gauge boost, manifold pressure falls as the atmosphere's pressure falls, and part of the altitude loss passes straight through. If it holds a fixed absolute manifold pressure, the charge pressure is kept, but the compressor must work at a higher pressure ratio to do it. Which one a given controller does is set by its design and configuration; confirm it for your own system.
4.2 Higher Pressure Ratio Means Hotter Compressor Outlet Air
Compressing air heats it, and a higher pressure ratio heats it more. For a compressor with isentropic efficiency , the outlet temperature is:
Here and are the absolute inlet and outlet temperatures and for air. Section 9.3 works through the numbers step by step.
In Example 3, holding the same gauge boost at 84 kPa (24.81 inHg) station pressure raises the outlet temperature from 117 °C to 132 °C (243 °F to 270 °F). The extra heat lands on the intercooler, whose own cooling air is thinner on the same day. The second paper in this series covers cooling airflow.
4.3 Water Vapor Rides Through the Compressor
Compression does not change the Mixing Ratio, so the charge carries the same water per kilogram of dry air as the ambient air. Its vapor partial pressure, however, rises with the absolute pressure, and so does its dew point (Eq. 1.1 and 2.1). On the hot, humid day of Example 1, the Dew Point at the station is 21.4 °C (70.5 °F). Compressed to 200 kPa absolute (29.0 psia), the same air has a dew point of 33.4 °C (92.1 °F; computed).
A charge cooled below that temperature at manifold pressure condenses water in the intercooler and intake. Logging ambient Mixing Ratio with the charge pressure and temperature shows when a session gets close to that line.
4.4 Knock Margin Moves With the Charge, Not Just the Fuel
Higher intake temperature and higher intake pressure both raise an engine's octane requirement [6], [7]. One review of borderline-knock data put the sensitivity at about one octane number per 7 K (13 °F) of intake temperature, and three to four octane numbers per 10 kPa (1.45 psi) of intake pressure [7]. Higher ambient humidity works the other way [6] (Section 7). These magnitudes are engine-specific; they show which channels matter, not values to apply.
5.0 Nitrous Oxide and Changing Air
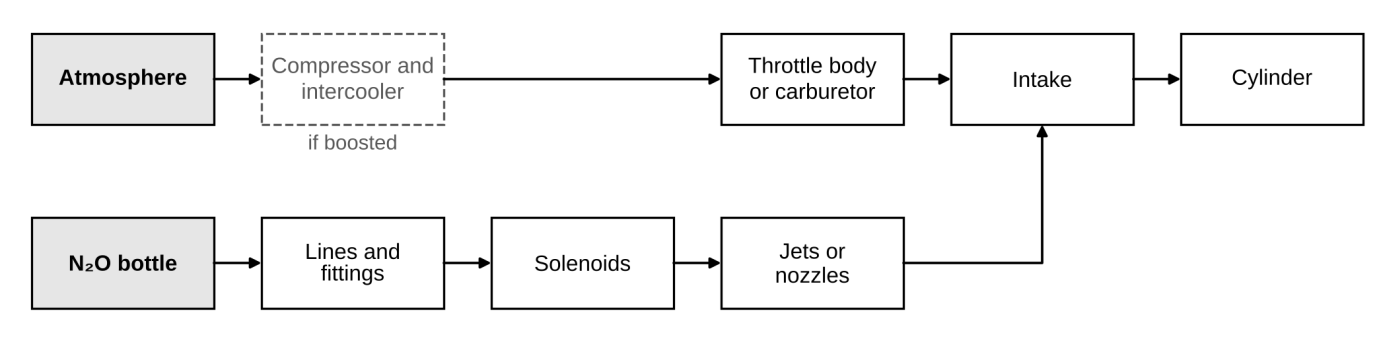
Nitrous oxide adds oxygen that does not come from the atmosphere. A nitrous-assisted engine therefore draws on two oxygen supplies: one that changes with the weather and one that does not. As the air changes, the balance between them shifts. Figure 5 shows the two supplies.
5.1 Why Nitrous Carries More Oxygen
N2O carries more oxygen per kilogram than air. Its one oxygen atom makes up 36.35 % of its mass, against 23.13 % for dry air (computed from its molar mass of 44.0128 g/mol [8]; Section 1). When it breaks down in the combustion chamber, N2O → N2 + ½O2, it also releases heat. Its standard enthalpy of formation is +82.05 kJ/mol [8], so decomposition gives back about 1.86 MJ per kilogram of N2O (801 BTU/lb; computed).
5.2 What Sets Nitrous Delivery
Nitrous is stored as a liquid under its own vapor pressure, which depends on the bottle temperature, not on the air around the car. It is about 5.03 MPa (730 psia) at 20 °C (68 °F) [9] and climbs toward the critical point at 36.45 °C (97.6 °F) and 7.245 MPa (1,051 psia) [8].
The mass that flows is set by that pressure and by every restriction between bottle and cylinder: the pickup tube, the bottle valve, the hoses and fittings, the solenoids, the plumbing to the jets, and the jets or nozzles. Any of them can limit flow, not only the jets. The manifold pressure behind the jets is small against the bottle pressure, and the air's temperature and humidity do not enter at all.
5.3 How the Balance Shifts
If nitrous delivery stays fixed while the air thins, the bottle supplies a larger share of the engine's oxygen. In Example 4, nitrous supplies 31.2 % of the oxygen on the cool, dry morning and 34.1 % on the hot, humid afternoon (Section 9). Total oxygen falls 8.5 % between those two days, less than the 12.4 % the air alone loses, because the nitrous does not fall with it. The mixture the fuel system must match has changed, even though nothing on the nitrous side has.
5.4 Two Temperatures, Two Meanings
Bottle temperature governs delivery; Ambient Air Temperature governs the air's share. They often move together on a hot day, but not always: think of a heated bottle on a cold night, or a cold bottle on a hot afternoon. Logging both keeps the two supplies apart in the data.
6.0 Compressed Air Supercharging
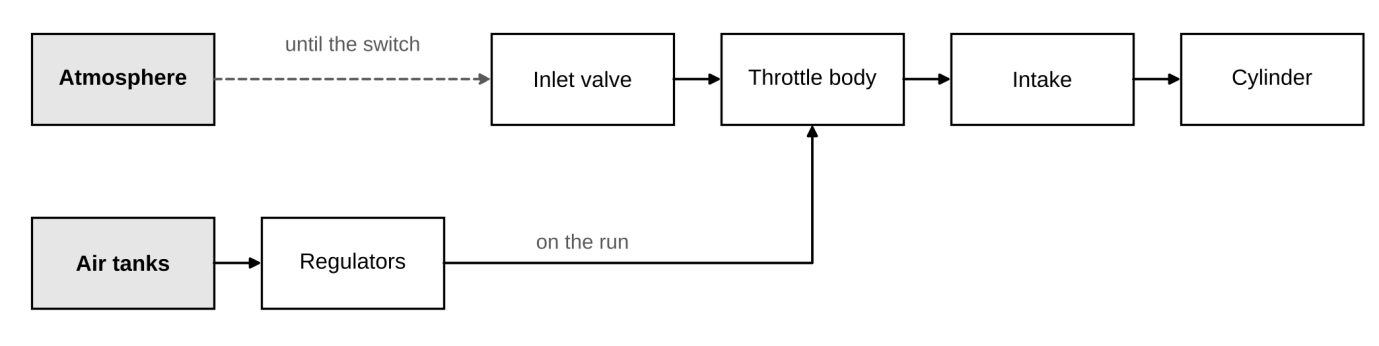
Compressed air supercharging feeds the engine from tanks of compressed air instead of a compressor. It is a newer power adder, with tanks filled to about 22.8 MPa (3,300 psig) [10], [11]. Figure 6 shows its oxygen path.
6.1 How the System Works
Regulators drop the tank pressure to a set boost, quoted from about 34 to 138 kPa (5 to 20 psig) [10]. A valve in the inlet tract closes when boost is applied, so the engine then breathes only air from the tanks [11]. Cars commonly make the burnout and stage naturally aspirated, then switch to bottled air for the run [10].
6.2 What Changes for the Air
Three things change for the air. First, the oxygen fraction is that of ordinary air: unlike nitrous, the tank adds more air, not an oxygen-rich compound. Second, the air expands on its way from the tank and arrives cold; reported intake temperatures range from about −29 °C (−20 °F) to 4 °C (40 °F) [10]. Third, how much water the tank air carries depends on how it was filled (Section 6.3).
6.3 How Dry the Tank Air Is
Breathing-air standards demand very dry air: the US workplace rule for breathing-air cylinders sets a dew point of −46 °C (−50 °F) or lower [12]. Nothing published says racers' fills meet that, and a portable compressor at the track may not.
Compression itself removes most of the water as condensate. Air saturated at 3,300 psig and 30 °C (86 °F) holds roughly 0.1–0.2 g/kg (1–2 gr/lb) once it expands, and more after a hot fill. Day B of Example 1, by comparison, carries 16.41 g/kg (115 gr/lb). These are computed estimates; the range allows for real air holding more water than an ideal gas at that pressure. They hold only if the compressor's separators drain the condensed water. Liquid water carried into the tank adds to it, and only a measurement settles how dry a given fill is.
6.4 What the Day's Air Still Governs
On bottled air, the day's Air Density and Mixing Ratio no longer set the oxygen supply. They still describe the naturally aspirated part of the run, and the tank's starting temperature follows the day. The systems are described as not legal in most sanctioned classes [10]; the current rulebook governs.
7.0 Fuels: Stoichiometry, Latent Heat and Knock Margin
The fuel does not change how much oxygen the air brings. It changes almost everything else: how much fuel that oxygen burns, how much the charge cools, and how much pressure and temperature the mixture tolerates before it knocks. Per kilogram of air, the fuels in Table 3 release nearly the same energy; their differences show up in charge temperature and knock margin.
| Property | Pump gasoline (US) | Unleaded Race Gasoline a | E85 b | Ethanol (neat) | Methanol |
|---|---|---|---|---|---|
| Mixture | |||||
| Stoichiometric air–fuel ratio, by mass | 14.6–14.7 [13], [14] | 13.7–14.1 [15] | ≈ 9.8 c | 9.0 [13], [14] | 6.45 [13] |
| Charge Cooling | |||||
| Latent heat of vaporization, kJ/kg fuel (BTU/lb) | 341–359 (147–154) [16] | — d | ≈ 840 (≈ 361) * | 919–936 (395–402) [16] | 1,160–1,177 (499–506) [13], [16] |
| Latent heat per kg of air at stoichiometric, kJ/kg (BTU/lb) | ≈ 24 (≈ 10) * | — | ≈ 86 (≈ 37) * | ≈ 102 (≈ 44) * | ≈ 182 (≈ 78) * |
| Energy | |||||
| Lower heating value, MJ/kg (BTU/lb) | 43.45 (18,680) [13] | — | ≈ 29.3 (≈ 12,600) * | 26.95 (11,590) [13] | 20.09 (8,640) [13] |
| Energy per kg of air at stoichiometric, MJ/kg (BTU/lb) | 2.96 (1,271) * | — | 2.99 (1,286) * | 2.99 (1,287) * | 3.12 (1,339) * |
| Knock and Oxygen | |||||
| Octane | AKI 84–93 e [17], [13] | AKI 100 and 104 f [15] | Varies with ethanol content | RON ≈ 110, MON ≈ 90 [16] | RON 112, MON 88 g [18] |
| Oxygen in the fuel, wt % | — | 3.7–4.7 [15] | ≈ 29.8 * | 34.7 [13] | 49.9 [13] |
* Computed from the referenced values. E85 properties are mass-weighted from the gasoline and ethanol columns using the blending relation of [14], which takes 14.6 for the gasoline part (the gasoline column itself uses 14.7 [13]). Per-kilogram-of-air values divide the per-kilogram-of-fuel value by the stoichiometric air–fuel ratio. Values in parentheses are in BTU/lb (1 kJ/kg = 0.4299 BTU/lb).
a Sunoco 260 GT and 260 GT Plus. b At a nominal 85 vol % ethanol. c ≈ 9.9 at the 83 % specification maximum; ≈ 11.7 at 51 vol % (computed from [14]). d Not published for these fuels.
e Posted as AKI, (R+M)/2 [17]; range across US grades [13]. f AKI 100 (RON 105, MON 95) and AKI 104 (RON 110, MON 98). g By an incipient-knock method.
Published values differ between sources, blends and production batches; ask the fuel supplier for the data on the fuel actually in the tank.
7.1 Stoichiometry: The Oxygen Sets the Ceiling
A stoichiometric mixture burns all the fuel with all the oxygen. Alcohols carry oxygen in the molecule, so each kilogram (or pound) needs less air: 9.0 kg for ethanol and about 6.45 kg for methanol, against about 14.7 kg for gasoline [13]. Each kilogram of alcohol also carries less energy, so the energy released per kilogram of air comes out nearly the same for every fuel (Table 3). In plain terms, a fuel change does not repeal the air. Whatever the fuel, the oxygen delivered (Sections 1–6) sets the ceiling.
7.2 Latent Heat and Charge Cooling
Fuel that evaporates in the intake takes its heat of vaporization from the air around it. Per kilogram of air, methanol absorbs the most heat and gasoline the least (Table 3). If all of that heat came out of the air, it would cool the air by about 181 K (327 °F) with methanol, 102 K (183 °F) with ethanol and 24 K (42 °F) with gasoline (computed with = 1.006 kJ/(kg·K) [5]).
These are upper bounds that real engines never reach. Only part of the fuel evaporates before the intake valve closes, and part of the heat comes from the walls. Measured per kilogram of stoichiometric mixture, the heat of vaporization is about 22 kJ for a hydrocarbon fuel and 92 kJ for ethanol [16]. The cooler charge is denser and has more knock margin, which is a large part of why alcohols tolerate more boost and compression.
7.3 Octane Conventions
In the United States, the number on the pump is the Anti-Knock Index, AKI = (RON + MON)/2, labeled "(R+M)/2 Method" [17]. RON and MON come from two ASTM engine tests [19]. The federal rule cites the D2699-15a and D2700-14 editions [17]; the current editions are D2699-26 and D2700-26b [19]. In Europe and many other markets, the posted number is RON, so a "95" fuel abroad and a "95" fuel in the US are not the same rating.
The standard methods are not intended for fuels made mostly of oxygenates [19], so neat-alcohol octane numbers differ by method and source. The methanol figures in Table 3 came from an incipient-knock method, because the standard procedure gave anomalous results [18].
7.4 Knock Margin Moves With the Air
For a given fuel, the octane the engine needs rises with intake temperature and pressure (Section 4) [6], [7]. Ambient humidity works the other way: higher absolute humidity counteracts the effect of temperature on octane requirement [6]. As early as 1937, humidity was found to change knock ratings by more than three octane numbers for some test and reference fuels [20]. A recent engine study describes humidity as acting like recirculated exhaust gas, enough to change the best spark timing [21]. Pump gasoline has the least margin of the fuels compared here, so it is the most sensitive to charge temperature and humidity.
7.5 E85 Is a Range, Not a Fixed Fuel
The current ASTM specification for ethanol fuel blends, D5798-25, covers 51 % to 83 % ethanol by volume [19], and US pump labels for flex fuels may read "51%–83% ethanol" [17]. Across that range the stoichiometric air–fuel ratio moves from about 11.7 to about 9.9, and the latent heat and energy content move with it (computed from [14]). Two tanks of "E85" bought in different seasons can be different fuels. Logging the ethanol content, where a sensor is fitted, lets a change in result be traced to the fuel or to the air.
7.6 Methanol
Methanol has a long history in racing, including open-wheel oval racing in the United States and alcohol drag classes. Of the fuels compared here, it has the largest latent heat, the most oxygen in the molecule and the most fuel per kilogram of air. Its cooling potential is far larger than the gap between air temperature and Dew Point on a cool, humid day. The charge can therefore be cooled to or below the air's dew point (Section 2), which is one more reason Dew Point earns a place in a methanol engine's log.
7.7 Race Gasolines Differ Among Themselves
Published stoichiometric ratios for commercial race gasolines run from about 15 for non-oxygenated grades to about 13.2 for a heavily oxygenated grade [15]. The label "race gas" says little about stoichiometry; the data sheet does.
7.8 Published Data for Three Common Race Fuels
VP Racing Fuels posts typical values on each product page. Table 4 shows three fuels widely used in drag racing, and how far fuels sold for racing can differ.
| Property | VP C25 [22] | VP Q16 REG [22] | VP M1 [22] |
|---|---|---|---|
| Described by the maker as | Leaded, not oxygenated; for naturally aspirated engines up to 17:1 compression and Pro Mod EFI nitrous engines | Leaded, oxygenated (contains MTBE); designed primarily for intercooled forced-induction drag engines | Racing methanol, 99.95 % minimum purity |
| Stoichiometric air–fuel ratio, by mass | 15.06 | 13.33 | 6.45 |
| Oxygen in the fuel, wt % | 0 | 9.41 | 49.93 |
| Specific gravity | 0.6985 | 0.7200 | 0.7950 |
| RON / MON / (R+M)/2 | >120 / 114 / >117 | >120 / 116 / >118 | 102 / >120 / 111 |
| Reid vapor pressure, kPa (psi) | 49.3 (7.15) | 38.9 (5.64) | 31.7 (4.6) |
Typical values from VP's specification sheets (rev. 10/04/19), which match VP's product pages as of October 2026, except that the Q16 REG page also lists 0.7155, 9.38 % and 7.25 psi; the sheet values are used here. Neither source states the test methods, and neither publishes latent heat or heating value.
C25's posted stoichiometric ratio agrees within 0.4 % with the 15.11 computed from its posted hydrogen-to-carbon ratio of 2.23. M1's posted octane numbers (RON 102, MON above 120) are far from the incipient-knock figures for methanol in Table 3 (RON 112, MON 88 [18]); octane numbers for neat alcohols depend on the method used.
M1 is VP's pure grade, for classes whose rules require pure methanol. VP's M5 adds combustion additives, and VP states that it is not pure methanol and will not pass a water test [22]. Fuel rules and fuel tests differ between sanctioning bodies and classes, so the current rulebook governs.
8.0 Error Sources in Measuring the Air, and How to Quantify Them
The air is easy to measure badly. Most of the error in a logged atmosphere comes not from the instrument but from where it sits, which pressure it reports, and which equation turns the readings into the channel on the screen.
8.1 Sensitivity: What One Unit of Error Is Worth
Table 5 gives the change in each derived channel for a small error in each measured input (computed from Eq. 1.2, 1.3 and 2.4). It describes the physics, not any particular instrument; an instrument's own accuracy is in its datasheet.
| Input error | Air Density | Dry-air (oxygen) density | Density Altitude, m (ft) |
|---|---|---|---|
| 15 °C (59 °F), 101.325 kPa (29.92 inHg), 50 % RH | |||
| +1 K (1.8 °F) temperature | −0.37 % | −0.40 % | +38 (+126) |
| +0.1 kPa (0.03 inHg) pressure | +0.10 % | +0.10 % | −10 (−34) |
| +3 % RH | −0.02 % | −0.05 % | +2 (+7) |
| 35 °C (95 °F), 99.0 kPa (29.23 inHg), 45 % RH | |||
| +1 K (1.8 °F) temperature | −0.38 % | −0.47 % | +39 (+127) |
| +0.1 kPa (0.03 inHg) pressure | +0.10 % | +0.10 % | −10 (−34) |
| +3 % RH | −0.06 % | −0.18 % | +7 (+22) |
Two points stand out. Temperature is the most sensitive input for errors of these typical sizes, so where it is measured matters more than almost anything else. And a humidity error is worth three to four times as much on a hot, humid day as on a mild one, and nearly three times as much to the oxygen as to the total density.
8.2 Placement and Heat Soak
An air temperature reading taken in an engine bay, on a sun-heated panel, inside a closed trailer or in stagnant pit air reads warm and lags real changes. A reading 5 K (9 °F) high understates Air Density by about 2 % and overstates Density Altitude by more than 190 m (600 ft) (computed from Table 5). Mount the sensor in free-flowing ambient air, out of direct sun and away from heat sources, and keep it in the same place when comparing sessions.
8.3 Station Pressure, Not Sea-Level Pressure
Every equation in this paper takes station pressure, the absolute pressure where the car is. Weather reports and airport data usually give pressure corrected to sea level, which is a different number. At a track 300 m (980 ft) above sea level, the corrected figure is about 3.6 % higher than station pressure (computed from [3]). Used by mistake, it overstates Air Density by the same 3.6 %.
8.4 Humidity on Dry Days and Wet Days
Relative humidity is often specified over a narrower band than 0–100 %; check the instrument's datasheet. Dew Point derived from a small relative humidity is especially sensitive, because the less water in the air, the larger the temperature change a small vapor-pressure error represents. On hot days the opposite problem appears: the whole humidity term is large, so its error is too (Table 5).
8.5 Which Equation
Different calculators give different answers from the same readings:
- Dry-bulb density altitude. A density-altitude formula that uses air temperature without humidity reads 99 m (324 ft) lower than Eq. 2.4 for Day B of Example 1 (computed). The National Weather Service form avoids this by using virtual temperature [4].
- Ideal gas vs. CIPM-2007. Treating air as an ideal gas () understates Air Density by about 0.02–0.06 % at ground-level conditions (computed from [1]). The error is small, but systematic.
- Saturation vapor pressure fits. Simple Magnus-type fits used for dew point differ slightly from the reference equation [2]. Within their stated range the difference is small; outside it they should not be used.
- Enthalpy zero points. Specific Enthalpy in kJ/kg is zero for dry air at 0 °C; in BTU/lb it is conventionally zero at 0 °F [5]. At 20 °C (68 °F) and 7.26 g/kg (50.8 gr/lb), a kJ/kg value converted to BTU/lb reads 16.6 BTU/lb, while an inch-pound psychrometric chart shows 24.2 BTU/lb (computed). Neither is wrong; they are measured from different zeros.
8.6 A Systematic Approach
Log the measured temperature, pressure and humidity alongside the derived channels, so the record of the air is complete. Record where the sensor was mounted. Take every derived channel in a comparison from the same source. Compare sessions with the same instrument in the same place, and treat a change smaller than the sensitivities above as no change.
9.0 Worked Examples
Every result below is computed from the equations in Sections 1–5 with the inputs listed; nothing is read from a chart or rounded from memory. The days, engine and nitrous flow are illustrative, chosen to show the size of each effect, not to describe a particular car.
9.1 Example 1: Three Days, One Engine
Three illustrative days: Day A, a cool, dry morning; Day B, a hot, humid afternoon at the same track on another day; and Day C, a mild day at a track with lower station pressure. Table 6 lists the inputs and the computed channels (Eq. 1.1–1.3 and 2.1–2.4, with the CIPM-2007 constants [1]).
| Channel | Day A | Day B | Day C |
|---|---|---|---|
| Inputs | |||
| Ambient Air Temperature, °C (°F) | 10 (50) | 35 (95) | 20 (68) |
| Absolute Pressure, station, kPa (inHg) | 101.5 (29.97) | 99.0 (29.23) | 84.0 (24.81) |
| Relative Humidity, % | 30 | 45 | 20 |
| Computed | |||
| Dew Point, °C (°F) | −6.7 (19.9) | 21.4 (70.5) | −3.6 (25.6) |
| Mixing Ratio, g/kg (gr/lb) | 2.27 (16) | 16.41 (115) | 3.50 (24) |
| Air Density, kg/m³ (lb/ft³) | 1.248 (0.0779) | 1.109 (0.0692) | 0.996 (0.0622) |
| Dry-air (oxygen-bearing) density, kg/m³ (lb/ft³) | 1.245 (0.0777) | 1.091 (0.0681) | 0.993 (0.0620) |
| Oxygen, kg/m³ (lb/ft³) | 0.288 (0.0180) | 0.252 (0.0158) | 0.230 (0.0143) |
| Relative Air Density, % | 101.9 | 90.5 | 81.3 |
| Density Altitude, m (ft) | −191 (−628) | 1,027 (3,370) | 2,100 (6,889) |
| Pressure Altitude, m (ft) | −15 (−48) | 195 (641) | 1,554 (5,098) |
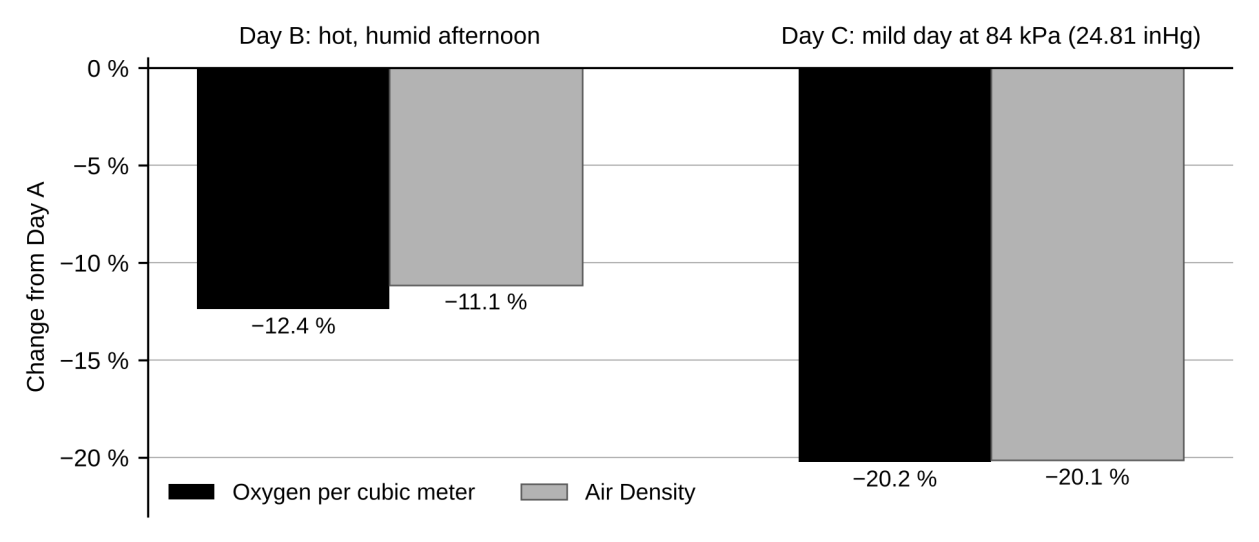
From Day A to Day B, Air Density falls 11.1 % but the oxygen per cubic meter falls 12.4 % (Figure 7). Day B's humidity accounts for the gap: its water vapor adds no oxygen the engine can burn. From Day A to Day C, both fall about 20 %.
On Day B, Density Altitude sits about 830 m (2,730 ft) above Pressure Altitude, the combined effect of heat and humidity at a track near sea level. Pressure Altitude also differs between Days A and B at the same track, by about 210 m (690 ft). It follows station pressure, which moves with the weather, not with the track's elevation.
9.2 Example 2: Humidity Alone
Two temperatures, 15 °C (59 °F) and 35 °C (95 °F), at 101.325 kPa (29.92 inHg), with relative humidity from 0 to 100 % (Eq. 1.2 and 1.3). Figure 8 shows the result.
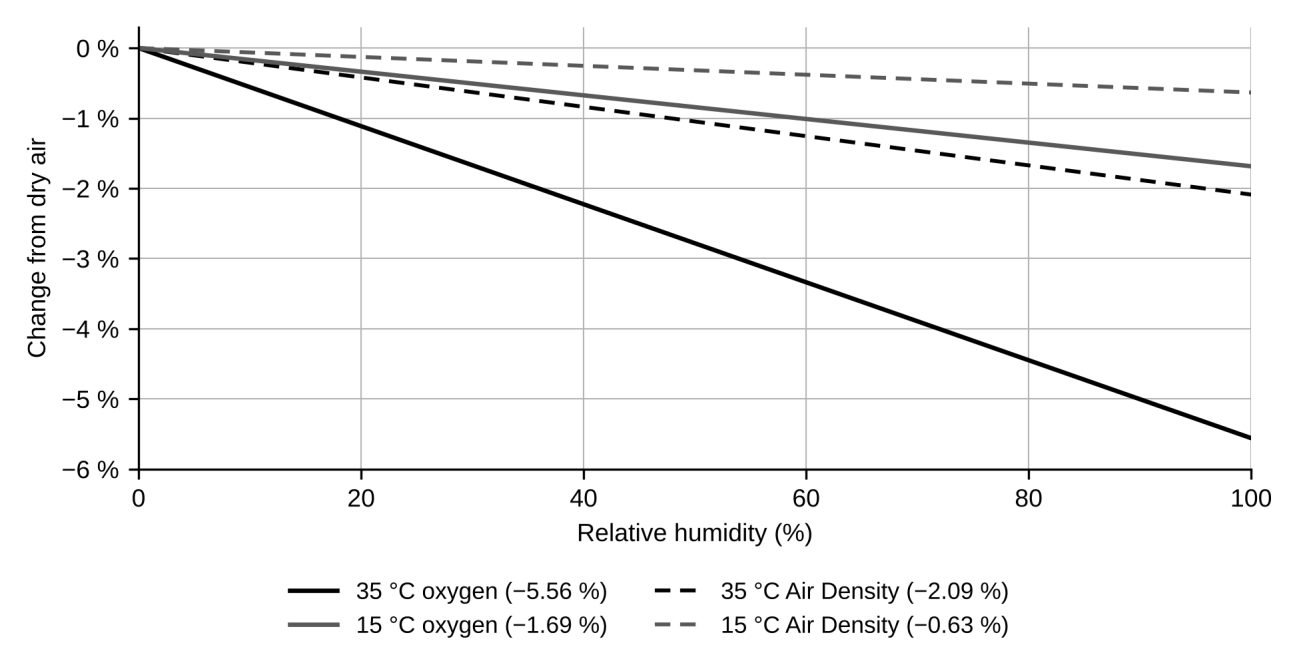
At both temperatures, the oxygen loss is about 2.7 times the density loss. A discussion that quotes "about half a percent" for humidity on a mild day is quoting total density; one that quotes several percent on a hot day is quoting oxygen. For an engine, the oxygen figure is the one that matters.
9.3 Example 3: Same Boost, Thinner Air
A compressor draws 25 °C (77 °F) air, with an illustrative isentropic efficiency and inlet losses ignored (Eq. 4.1 and 4.2). It holds 100 kPa (14.5 psig) of gauge boost at sea level, where the station pressure is 101.3 kPa (29.91 inHg), and again at a track with 84.0 kPa (24.81 inHg). A third case holds 200 kPa (29.0 psia) absolute at 84.0 kPa. Worked through for the sea-level case:
- Pressure ratio, from Eq. 4.1: .
- Exponent: , so .
- Outlet temperature, from Eq. 4.2: , which is 117 °C (243 °F).
Table 7 gives all three cases.
| Case | Manifold absolute pressure, kPa (psia) | Pressure ratio | Compressor outlet temperature, °C (°F) |
|---|---|---|---|
| Sea level, 100 kPa (14.5 psig) gauge boost | 201.3 (29.2) | 1.99 | 117 (243) |
| 84.0 kPa (24.81 inHg) station, same 100 kPa (14.5 psig) gauge boost | 184.0 (26.7) | 2.19 | 132 (270) |
| 84.0 kPa (24.81 inHg) station, 200 kPa (29.0 psia) absolute held | 200.0 (29.0) | 2.38 | 145 (293) |
Holding gauge boost loses 8.6 % of the manifold pressure. Holding absolute pressure keeps it, at the cost of a 20 % higher pressure ratio and a compressor outlet 27 K (49 °F) hotter for the intercooler to cool.
9.4 Example 4: Nitrous With Changing Air
An illustrative 5.7 L (348 cu in) four-stroke engine runs at 6,500 rpm with , applied to the dry-air partial density. It adds a fixed 0.10 kg/s (794 lb/h) of nitrous on the three days of Example 1 (Eq. 1.2 and 1.4, with the oxygen fraction of N2O from Section 5). Table 8 gives the results.
| Day | Dry-air flow, kg/s (lb/h) | Oxygen from air, kg/s (lb/h) | Oxygen from nitrous, kg/s (lb/h) | Nitrous share of oxygen, % |
|---|---|---|---|---|
| A | 0.346 (2,745) | 0.0800 (635) | 0.0364 (289) | 31.2 |
| B | 0.303 (2,406) | 0.0701 (556) | 0.0364 (289) | 34.1 |
| C | 0.276 (2,190) | 0.0638 (507) | 0.0364 (289) | 36.3 |
Total oxygen falls 8.5 % from Day A to Day B and 13.9 % from Day A to Day C, while the nitrous share rises by about 3 and 5 percentage points. The engine's mixture requirement changes with the weather even though the nitrous delivery did not.
10.0 What to Watch for Your Combination
Table 9 lists the atmospheric channels worth logging for each engine type and fuel, and why. It deliberately gives no correction amounts: what to do about a change in the air is a tuning decision for your engine, your fuel and your tuner. Log the air alongside the engine-side channels in the last column, so a change in the result can be traced to the air, or ruled out.
| Combination | Atmospheric channels to log | Why they matter for this combination | Log them alongside |
|---|---|---|---|
| Naturally aspirated, any fuel | Air Density or Relative Air Density; Absolute Pressure; Ambient Air Temperature; Mixing Ratio | Trapped oxygen follows dry-air density (Eq. 1.2). The density channels show the trend; Mixing Ratio shows how much of the air is water vapor rather than oxygen-bearing air (Example 2) | Intake air temperature, manifold absolute pressure, lambda, engine speed, throttle |
| Turbocharged or supercharged, any fuel | Absolute Pressure; Ambient Air Temperature; Mixing Ratio; Dew Point | Absolute Pressure sets the pressure ratio needed for a given manifold pressure (Eq. 4.1); inlet temperature sets the compressor outlet temperature (Eq. 4.2); Mixing Ratio is the water that rides through to the charge, and Dew Point tells when a cooled, compressed charge approaches condensation (Section 4) | Manifold absolute pressure, boost target and whether it is gauge or absolute, intake air temperature after the intercooler, knock |
| Nitrous oxide, added to either | Air Density; Mixing Ratio; Ambient Air Temperature | Nitrous delivery is set by bottle pressure and the installation's restrictions (pickup tube, bottle valve, lines and fittings, solenoids, jets or nozzles), not by the air, so the share of oxygen from nitrous moves as Air Density moves (Section 5, Example 4) | Bottle pressure and bottle temperature, activation, fuel pressure, lambda, exhaust gas temperature, knock |
| Compressed air from tanks | Ambient Air Temperature; Absolute Pressure; Mixing Ratio | The day's air governs the naturally aspirated part of the run (burnout, staging); on bottled air the oxygen supply follows the regulated pressure and the cold tank air instead, whose water content depends on the fill (Section 6) | Tank pressure, regulated or manifold pressure, intake air temperature, the point of the switch to bottled air |
| Pump gasoline | Ambient Air Temperature; Mixing Ratio; Dew Point | The smallest knock margin of the fuels in Section 7; it moves with charge temperature, and humidity moves it the other way (Section 7) | Knock, intake air temperature, ignition timing delivered |
| Unleaded or leaded race gasoline | Air Density; Ambient Air Temperature; Mixing Ratio | More knock margin than pump fuel; temperature still governs that margin at high boost or compression. Stoichiometry differs between race fuels (Section 7) | Knock, intake air temperature, lambda |
| E85 and other ethanol blends | Ambient Air Temperature; Mixing Ratio; Air Density | Ethanol content varies within 51–83 % by volume (Section 7), so the same air and the same calibration can give different results; logging the air separates a weather change from a fuel change | Ethanol content where a sensor is fitted, fuel temperature, lambda, knock, intake air temperature |
| Methanol | Ambient Air Temperature; Dew Point; Mixing Ratio; Air Density | The largest charge-cooling potential of the fuels in Section 7; on cool, humid days the charge can reach the air's dew point (Section 7) | Lambda where measured, exhaust gas temperature by cylinder, fuel pressure or flow, intake air temperature |
Pressure Altitude and Density Altitude are convenient for comparing a session with a familiar track or an old log, and Density Altitude carries the same information as Air Density in a unit many racers already think in. Neither replaces Mixing Ratio when the question is how much of the air is water.
10.1 Where Plimpton Innovations Fits
The WSCAN Atmospheric Sensor, CAN Output delivers up to twelve atmospheric channels over CAN, among them Air Density, Relative Air Density, Density Altitude, Mixing Ratio and Dew Point, so the air is recorded in the same log as the run. The WSANA Atmospheric Sensor, Analog Output delivers four atmospheric channels as 0–5 V signals for a data logger's or ECU's analog inputs. As standard these are Ambient Air Temperature, Absolute Pressure, Density Altitude and Mixing Ratio (water grains), or up to four channels of your choice, configured to order. Measurement ranges, accuracy and timing are in each product's current datasheet.
11.0 Standard Correction Factors and Why They Disagree
Power-correction standards convert a power measured on one day to the power the same engine would make at agreed reference conditions, so tests on different days and in different places can be compared. They are agreements, not laws of physics, and the main ones do not agree with each other (Table 10).
| Standard | Reference conditions | Pressure used | Notes |
|---|---|---|---|
| UN Regulation No. 85 (spark-ignition engines, naturally aspirated or pressure-charged) | 298 K (25 °C, 77 °F), 99 kPa (29.23 inHg) | Dry-air pressure: total barometric pressure minus water-vapor pressure | Test conditions limited to 288–308 K (15–35 °C, 59–95 °F) and 80–110 kPa (23.6–32.5 inHg); the factor should lie between 0.93 and 1.07; outside that band the corrected figure must be reported with the test conditions stated precisely [23] |
| SAE J1349 | 25 °C (77 °F), 99 kPa (29.23 inHg) dry-air pressure, as reported for the 2004 edition [24] | Dry-air pressure | Revised in November 2025 (J1349_202511) [25] |
| DIN 70020 | 20 °C (68 °F), 101.3 kPa (29.91 inHg) | Total pressure, no humidity term [26] | Still quoted in older data; form as reproduced in [26] |
The spark-ignition forms are below, with the dry-air pressure and the total pressure in kPa, and in K. The R85 form is as printed in the official text [23]; the DIN form is as reproduced in [26]:
11.1 Worked Example: Correcting Day B
Day B of Example 1 is 35 °C (95 °F), 99.0 kPa (29.23 inHg) and 45 % RH. Its dry-air pressure, the station pressure minus the water-vapor pressure, is (computed).
- Pressure term: .
- Temperature term: , so .
- R85-form factor: .
- DIN form, for comparison: .
An observed 500 hp (373 kW) on Day B therefore corrects to about 526 hp (392 kW) with the R85 form and 525 hp (391 kW) with the DIN form (computed). Table 11 applies both forms to all three days.
| Day | Conditions | Dry-air pressure, kPa (inHg) | R85-form factor | DIN-form factor |
|---|---|---|---|---|
| A | 10 °C (50 °F), 101.5 kPa (29.97 inHg), 30 % RH | 101.13 (29.86) | 0.945 | 0.981 |
| B | 35 °C (95 °F), 99.0 kPa (29.23 inHg), 45 % RH | 96.46 (28.48) | 1.053 | 1.050 |
| C | 20 °C (68 °F), 84.0 kPa (24.81 inHg), 20 % RH | 83.53 (24.67) | 1.214 | 1.207 |
11.2 Why They Disagree
Three choices differ between standards. First, the reference conditions differ, so the same run corrects to different numbers. Second, some use dry-air pressure and some total pressure. At 30 °C (86 °F) and 100 kPa (29.53 inHg), raising humidity from 10 % to 90 % moves the R85-form factor from 1.003 to 1.046, while the DIN-form factor does not move at all (computed). Third, the exponents differ. Each standard encodes its own approximation of how volumetric efficiency, heat transfer and friction respond to temperature and pressure; this is the caution about in Section 1, written into a formula.
11.3 Where the Formulas Stop Applying
Day C's R85-form factor falls far outside the 0.93–1.07 band that UN Regulation No. 85 sets. A correction that large is no longer a small adjustment, and the regulation then requires the test conditions to be stated precisely beside the corrected figure. Day A's 10 °C (50 °F) is also below the regulation's lower test limit of 15 °C (59 °F).
A boosted engine whose controller holds manifold pressure (Section 4) does not respond to the atmosphere the way the formulas assume either. A corrected figure for it describes the standard more than the engine.
11.4 What to Report
The most useful dyno or track record states the observed figure, the standard and edition used for any corrected figure, and the logged air: Ambient Air Temperature, Absolute Pressure, and Relative Humidity or Mixing Ratio. With those, anyone can recompute any correction later, including one that has not been written yet.
12.0 References
Standards and paywalled papers are cited by number and edition; links go to the publisher's page or a free copy.
- [1] A. Picard, R. S. Davis, M. Gläser and K. Fujii, "Revised formula for the density of moist air (CIPM-2007)," Metrologia, vol. 45, pp. 149–155, 2008. NIST copy
- [2] W. Wagner and A. Pruss, "International equations for the saturation properties of ordinary water substance. Revised according to the International Temperature Scale of 1990," J. Phys. Chem. Ref. Data, vol. 22, no. 3, pp. 783–787, 1993, doi: 10.1063/1.555926. NIST reprint
- [3] NOAA, NASA and USAF, U.S. Standard Atmosphere, 1976, NOAA-S/T 76-1562, 1976. DTIC copy
- [4] US National Weather Service, "Pressure altitude" and "Density altitude" calculation notes. Pressure altitude; Density altitude
- [5] ASHRAE, ASHRAE Handbook — Fundamentals, 2017, ch. 1, eq. 30 (moist-air enthalpy, SI and I-P), as implemented in the PsychroLib library.
- [6] R. Potter, E. Scott, H. Gibson and G. Stanke, "Weather or Knock? Road Ratings and Requirements, Year-Round," SAE Technical Paper 540247, 1954. doi:10.4271/540247
- [7] S. Russ, "A Review of the Effect of Engine Operating Conditions on Borderline Knock," SAE Technical Paper 960497, 1996. doi:10.4271/960497
- [8] NIST, "Nitrous oxide," Index of Semiconductor Process Gases (Page), and NIST-JANAF Thermochemical Tables, nitrous oxide, table N-026 (Table).
- [9] B. S. Waxman, J. E. Zimmerman, B. J. Cantwell and G. G. Zilliac, "Mass flow rate and isolation characteristics of injectors for use with self-pressurizing oxidizers in hybrid rockets," 49th AIAA/ASME/SAE/ASEE Joint Propulsion Conf., San Jose, CA, USA, Jul. 2013. NASA NTRS
- [10] Trade press on compressed air supercharging: "Compressed air supercharging: Instant horsepower explained," EngineLabs (Page); "No prep star finds success with compressed air supercharging," Dragzine (Page).
- [11] Compressed Air Supercharging, "Is compressed-air supercharging the next big power adder?" maker's page. Page
- [12] US Occupational Safety and Health Administration, standard interpretation of 29 CFR 1910.134(i)(4)(iii), May 31, 2023 (moisture in breathing-air cylinders). Page
- [13] US DOE Alternative Fuels Data Center, "Properties of Fuels" (archived table, Archive) and "Fuel Properties Comparison" (Page).
- [14] K. Ahn, A. G. Stefanopoulou and M. Jankovic, "Estimation of ethanol content in flex-fuel vehicles using an exhaust gas oxygen sensor: Model, tuning and sensitivity," Proc. ASME Dynamic Systems and Control Conf., 2008, paper DSCC2008-2232. PDF
- [15] Sunoco Race Fuels, product pages with typical values: 260 GT; 260 GT Plus; Supreme; EX02.
- [16] G. M. Fioroni, E. Christensen, L. Fouts and R. McCormick, "Heat of vaporization and species evolution during gasoline evaporation measured by DSC/TGA/MS for blends of C1 to C4 alcohols in commercial gasoline blendstocks," SAE Tech. Paper 2019-01-0014, 2019, doi: 10.4271/2019-01-0014. NREL PDF; G. M. Chupka, E. Christensen, L. Fouts, T. L. Alleman, M. A. Ratcliff and R. L. McCormick, "Heat of vaporization measurements for ethanol blends up to 50 volume percent in several hydrocarbon blendstocks and implications for knock in SI engines," SAE Tech. Paper 2015-01-0763, 2015, doi: 10.4271/2015-01-0763. NREL PDF
- [17] US Code of Federal Regulations, 16 CFR Part 306, Automotive fuel ratings, certification and posting. eCFR
- [18] D. W. Naegeli, D. M. Yost, D. S. Moulton, E. C. Owens and G. K. Chui, "The measurement of octane numbers for methanol and reference fuels blends," SAE Tech. Paper 892038, 1989, doi: 10.4271/892038. SAE
- [19] ASTM D2699-26, Research Octane Number (Store); D2700-26b, Motor Octane Number (Store); D5798-25, Ethanol Fuel Blends for Flexible-Fuel Automotive Spark-Ignition Engines (Store).
- [20] J. R. MacGregor, "The influence of humidity on knock ratings," SAE Tech. Paper 370152, 1937, doi: 10.4271/370152. SAE
- [21] M. Hakeem et al., "Evaluating the benefits of on-board measurement of ambient humidity Part-1: Effect on spark timing and combustion efficiency," SAE Tech. Paper 2016-01-1067, 2016, doi: 10.4271/2016-01-1067. SAE
- [22] VP Racing Fuels, "Specification Sheet (Typical Values)," rev. 10/04/19, for C25, Q16 and M1, and product pages: C25; Q16 REG; M1; M5.
- [23] UN Regulation No. 85, uniform provisions for the measurement of net power, OJ EU 42014X1107(01), Annex 5. The same formula, reference conditions and limits are printed as text in its predecessor, Directive 80/1269/EEC, Annex I, § 6.4.1 (consolidated text of 31 December 1999). EUR-Lex; Directive 80/1269/EEC, consolidated
- [24] Shelquist Engineering, horsepower correction calculator notes (J1349 reference conditions, 2004 edition). Page
- [25] SAE International, Engine Power Test Code—Spark Ignition and Compression Ignition—As Installed Net Power and Torque Rating, SAE Standard J1349_202511, Nov. 2025.
- [26] J. R. Sodré and S. M. C. Soares, "Comparison of engine power correction factors for varying atmospheric conditions," J. Braz. Soc. Mech. Sci. Eng., vol. 25, no. 3, pp. 279–284, 2003, doi: 10.1590/S1678-58782003000300010. PDF